See It In Action
ExposureGuard Business Walkthrough
Watch a full end-to-end walkthrough of the ExposureGuard platform — from trade ingestion and BIS CEM exposure calculation through to the daily Risk Committee pack.
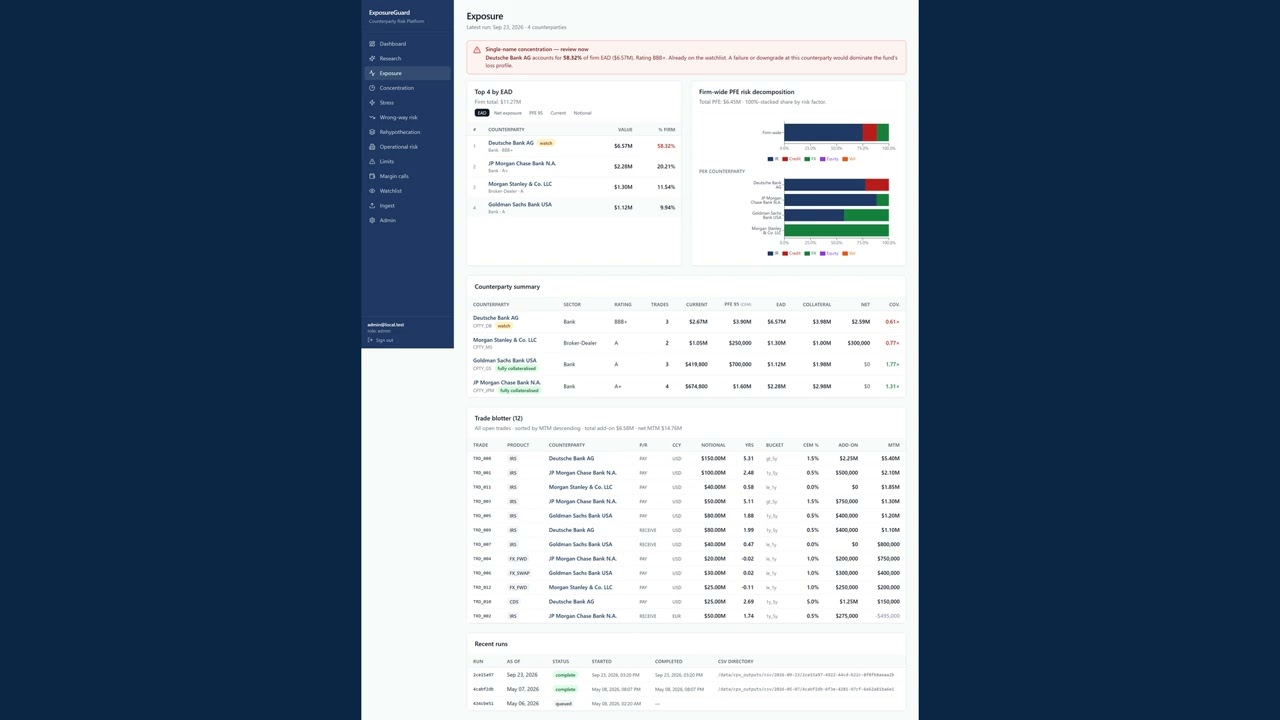
A hedge-fund-grade platform for daily counterparty exposure, PFE, VaR, and stress-testing under bilateral OTC derivatives. On-premises. Open methodology. No vendor terminal lock-in.
ExposureGuard ingests your trade book, ISDAs, CSAs, collateral, and limits, and emits a complete daily risk pack: 13 audit-grade CSVs and 5 distribution-ready Excel workbooks. Every number is reproducible bit-for-bit; every input and output carries a SHA-256 hash.
When Archegos Capital Management collapsed in March 2021, prime brokers lost ~$10B in five trading days. The post-mortem was unanimous: counterparty exposure data was siloed, stale, and aggregated by hand. Even sophisticated dealers couldn't see total bilateral exposure to a single family office across desks.
The tools that would have caught it cost $50–150k per user per year and require a dedicated vendor terminal. Below the top decile, an entire market — 5,000+ asset managers and hedge funds in the $500M–$5B AUM band — runs counterparty exposure monitoring on Excel spreadsheets emailed around at 6pm.
They know it's broken. They lack a tool that fits their economics, deployment posture, and operational reality.
Every module is a pure function of its inputs. Every output reconciles to its source. Auditable end-to-end.
Net Current Exposure floored at zero per netting set; PFE under BIS CEM with the netting-recognition formula; EAD = NCE + PFE. Per (counterparty, ISDA), then rolled up to a canonical Counterparty Summary.
Haircut-adjusted effective values per asset; per-CSA aggregation; VM Required after threshold; final margin call after MTA suppression and rounding-up.
PFE split into IR / Credit / FX / Equity / Vol per counterparty and firm-wide. CDS contributions allocate 70/30 Credit/IR per the configurable split; per-factor numbers reconcile to the netting-recognised PFE total.
Delta-normal VaR using DV01, CS01, and FX delta, combined through a 3 × 3 daily covariance matrix from configurable factor vols and correlations. Per-counterparty and firm-wide.
Six configurable shocks: rates ±100bp, USD strengthens 10%, credit spreads widen 50%, counterparty downgrade, combined stress. ΔEAD per (counterparty, scenario) and firm-wide.
2008 Financial Crisis, 2020 COVID, 1994 Bond Massacre, 2022 Rate Shock, plus an editable Custom Stagflation slot. Multi-factor shock vectors calibrated to peak-stress days, applied via linear repricing.
Per (counterparty, limit_type) utilisation against CURRENT_EXPOSURE / PFE / NOTIONAL / TENOR limits. OK / WARN / BREACH classification with conditional formatting in Excel.
Every input file SHA-256 hashed; every output SHA-256 hashed. Re-running with identical inputs produces byte-identical CSVs. The run manifest is your tamper-evident audit record.
Each workbook is built for a specific audience and answers a specific question. Branded headers, conditional formatting on limit utilisation, and frozen header rows for usability.
PMs, Risk Officers
Credit team
Operations desk
Risk Committee, weekly
Board / monthly
Every formula is documented, every coefficient is configurable, every result is reproducible. No licensed methodology, no proprietary black box, no vendor lock-in.
| Capability | Methodology | Configurable |
|---|---|---|
| Trade-level add-on | BIS CEM factor table (3 buckets × product family) | HY override factor; rating-based IG / HY classification |
| Netting recognition | A_net = 0.4 × A_gross + 0.6 × NGR × A_gross | Per-ISDA netting_eligible flag |
| Collateral haircut | Effective = MV × (1 − haircut) | Per-asset haircut from CSA JSON or row-level |
| Margin calls | VM = max(net MtM − threshold, 0); MTA suppression; ceil-rounding | Per-CSA threshold, MTA, rounding |
| Parametric VaR | z(α) × √(δT Σ δ) × √h | Annual factor vols + 3 explicit correlations |
| Stress repricing | Linear delta: ΔMtM = δ · shock_vector | Parametric scenarios in YAML; named historical replays editable |
| Limits | Utilisation = metric / limit; OK / WARN / BREACH classification | Per-cpty soft warning level (default 80%) |
BIS CEM, hand-calibrated factor vols, configurable correlations. No licensed methodology, no proprietary scoring, no black box. Quants can audit and extend.
Trade and counterparty data never leaves your network. SaaS multi-tenancy is not on offer — that's a feature, not a limitation, for a buy-side risk product.
Per-firm subscription, not per-seat. Designed for firms outgrowing spreadsheets but not big enough for tier-1 enterprise platforms.
Standalone CLI. No dependency on third-party data terminals. Bring your own market data via the standard CSV interface.
Every output reconciles to its inputs. SHA-256 manifest per run. Same inputs → byte-identical outputs. Compliance teams love it; regulators accept it.
Drops into the existing daily Risk Committee email. Outputs in the format risk teams already circulate. No retraining of human users required.
Seven CSV files: trades, counterparties, netting, csa, collateral, limits, market_data. Each row Pydantic-validated for type and referential integrity. Errors aggregated into a single consolidated report; no silent skips.
13 audit-grade CSVs (one per pipeline stage's output) plus 5 distribution-ready Excel workbooks. CSVs land in outputs/csv/<as_of>/<run_id>/; Excel parallels at outputs/excel/....
Python 3.12, single CLI command. Runs on any laptop or batch server. No database required for v1, but the data model maps 1:1 to Postgres schema. Docker packaging optional. Trade data never leaves your environment.
Every run produces run_manifest.csv with SHA-256 hashes of all inputs and all outputs. If a regulator asks “what produced this number?” you can prove it bit-for-bit.
Watch a full end-to-end walkthrough of the ExposureGuard platform — from trade ingestion and BIS CEM exposure calculation through to the daily Risk Committee pack.
We'll run the pipeline against a sample of your trade book and walk you through every number in the daily pack. 30 minutes. Your data, your environment.